
The markets are in a state of ecstasy, but investors may be underestimating lurking danger.
CNNMoney took a look at a slew of recent data on stock valuations and corporate sentiment, and while the prospects for global economic growth remain robust, savvy investors need to stay vigilant.
Here are the most four worrying signs for the markets right now:
1. Addiction to the Fed stimulus: Simply put, the financial markets are hooked on easy money, and that has caused them to ignore real economic and geopolitical vulnerabilities, according to an annual report released Sunday by the Bank for International Settlements (BIS), an organization of of central banks.
While the Federal Reserve and other central banks are widely credited with shoring up the financial system after the crisis by keeping interest rates low and driving investment into stocks, investors may have gotten ahead of themselves."It is hard to avoid the sense of a puzzling disconnect between the markets' buoyancy and underlying economic developments globally," the report said.
Related: America's 6 biggest public pensions
The BIS noted that investors aggressive search for yield has driven them into riskier European and emerging market bonds, as well as lower rated corporate debt. That has left them exposed to a host of problems should interest rates rise quickly or economic conditions deteriorate.
"Countries could at some point find themselves in a debt trap: seeking to stimulate the economy through low interest rates encourages even more debt, ultimately adding to the problem it is meant to solve," asserted the BIS.
2. Stocks are downright expensive: According to a popular metric of market valuation, stocks are trading at lofty levels previously experienced leading up market crashes. According to the Shiller PE Ratio, which tracks inflation-adjusted earnings over the past 10 years, the S&P 500 is currently trading at over 26 times earnings. The long-term average, going back more than 130 years, is 16.5.
The Shiller price-to-earnings ratio rose above 25 for the first time in 1901, then again in 1929. At the height of the tech stock craze in 2000, the ratio hit a record peak of 44 before the market collapsed. It was back above 25 in 2003 and stayed around that level until 2007 -- shortly before the so-called Great Recession.
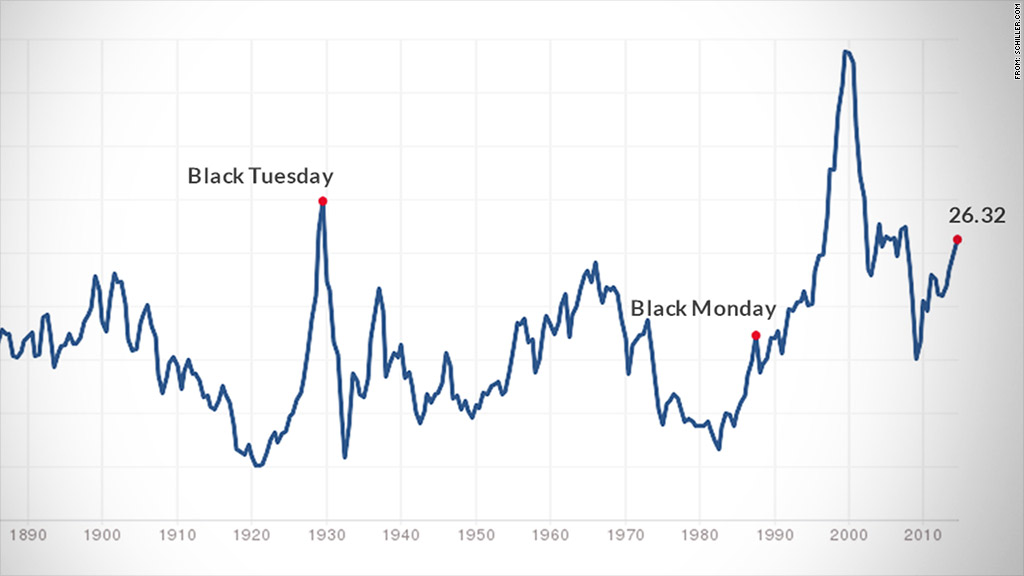
Source: Data from multpl.com based on Shiller PE Ratio
According to research by Credit Suisse, once it rises above 26, U.S. stock market returns are typically negative for the next five years.
3. Markets are far outpacing actual growth: Stocks are priced in the stratosphere compared to the overall health of the U.S. economy. David R. Kotok, Chairman and Chief Investment Officer at Cumberland Advisors in Sarasota, Florida, says that the only other time the total valuation of the stock market relative to U.S. growth domestic product (GDP) was higher was at the peak of the tech bubble.
"We think the probability of a correction is rising. It is very hard to pinpoint," Kotok explained in a research note Sunday.
Still, Kotok is stripping out the first quarter's decline in GDP for his calculations, and he admits that "GDP is not a perfect trading guide."
Related: 3 reasons not to freak out about -2.9% GDP
But "it does express that, when stocks are highly priced in the aggregate relative to GDP, the probability is higher that markets are becoming fully valued."
Worst Q1 GDP since recession
4. Corporate leaders aren't so optimistic anymore: In a survey revealed Monday by accounting and consulting behemoth Deloitte, Chief Financial Officers in the United States have lowered their earnings expectations for the year, with CFOs in manufacturing feeling particularly pessimistic.
CFOs' expectations for capital spending also fell, the Deloitte survey found.
"Net optimism is holding steady, but lower earnings and capital spending growth expectations suggest U.S. CFOs are factoring in bumps that were not on their radar screens three months ago," said Deloitte's Sanford Cockrell III in a press release.