셀스마트 SIK
·
4 months ago
0
0
Buy now or hold? Let our signals guide your decision.
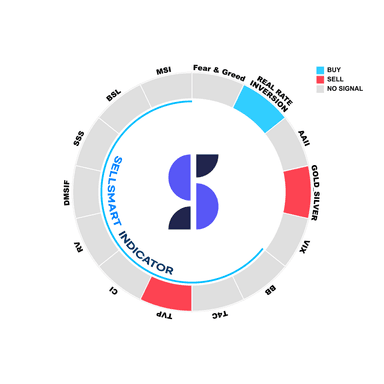
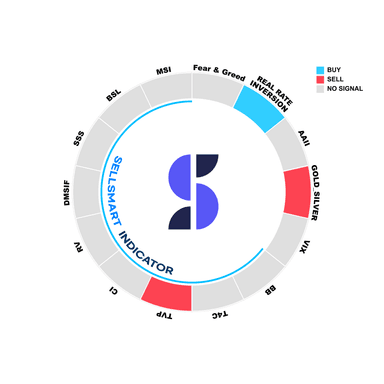
SELL signal detected for Time Varying Parameter.TVP(Time Varying Parameter) - Using time-series Bayesian techniques, this structural forecasting signal combines market indicators, macroeconomic data, and investor sentiment to predict price increases or decreases.
SELL signal detected for Gold-Silver Ratio.Gold-Silver Ratio - This signal interprets safe-haven sentiment by analyzing changes in the gold-to-silver price ratio. A rising preference for gold indicates growing market anxiety.
BUY signal detected for Real Rate Inversion.Real Rate Inversion - This signal detects abnormal yield structures where short-term real rates (1-year) exceed long-term real rates (10-year), warning of potential economic recessions.
Sell
셀스마트 SIK
·
4 months ago
0
0
Buy now or hold? Let our signals guide your decision.
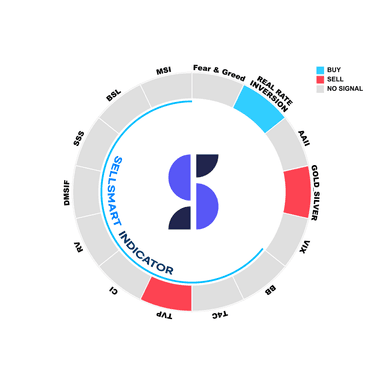
SELL signal detected for Time Varying Parameter.TVP(Time Varying Parameter) - Using time-series Bayesian techniques, this structural forecasting signal combines market indicators, macroeconomic data, and investor sentiment to predict price increases or decreases.
SELL signal detected for Gold-Silver Ratio.Gold-Silver Ratio - This signal interprets safe-haven sentiment by analyzing changes in the gold-to-silver price ratio. A rising preference for gold indicates growing market anxiety.
BUY signal detected for Real Rate Inversion.Real Rate Inversion - This signal detects abnormal yield structures where short-term real rates (1-year) exceed long-term real rates (10-year), warning of potential economic recessions.
Sell
셀스마트 SIK
·
4 months ago
0
0
Buy now or hold? Let our signals guide your decision.
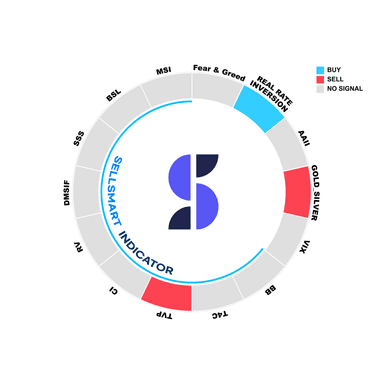
SELL signal detected for Time Varying Parameter.TVP(Time Varying Parameter) - Using time-series Bayesian techniques, this structural forecasting signal combines market indicators, macroeconomic data, and investor sentiment to predict price increases or decreases.
SELL signal detected for Gold-Silver Ratio.Gold-Silver Ratio - This signal interprets safe-haven sentiment by analyzing changes in the gold-to-silver price ratio. A rising preference for gold indicates growing market anxiety.
BUY signal detected for Real Rate Inversion.Real Rate Inversion - This signal detects abnormal yield structures where short-term real rates (1-year) exceed long-term real rates (10-year), warning of potential economic recessions.
Sell
셀스마트 SIK
·
4 months ago
0
0
Buy now or hold? Let our signals guide your decision.
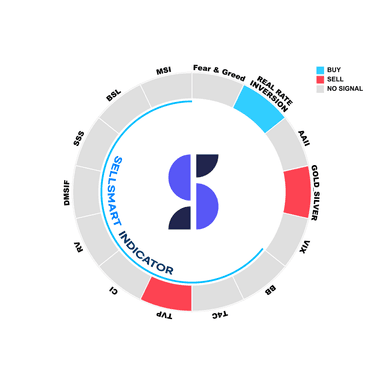
SELL signal detected for Time Varying Parameter.TVP(Time Varying Parameter) - Using time-series Bayesian techniques, this structural forecasting signal combines market indicators, macroeconomic data, and investor sentiment to predict price increases or decreases.
SELL signal detected for Gold-Silver Ratio.Gold-Silver Ratio - This signal interprets safe-haven sentiment by analyzing changes in the gold-to-silver price ratio. A rising preference for gold indicates growing market anxiety.
BUY signal detected for Real Rate Inversion.Real Rate Inversion - This signal detects abnormal yield structures where short-term real rates (1-year) exceed long-term real rates (10-year), warning of potential economic recessions.
Sell
셀스마트 SIK
·
4 months ago
0
0
Buy now or hold? Let our signals guide your decision.
SELL signal detected for Time Varying Parameter.TVP(Time Varying Parameter) - Using time-series Bayesian techniques, this structural forecasting signal combines market indicators, macroeconomic data, and investor sentiment to predict price increases or decreases.
SELL signal detected for Gold-Silver Ratio.Gold-Silver Ratio - This signal interprets safe-haven sentiment by analyzing changes in the gold-to-silver price ratio. A rising preference for gold indicates growing market anxiety.
BUY signal detected for Real Rate Inversion.Real Rate Inversion - This signal detects abnormal yield structures where short-term real rates (1-year) exceed long-term real rates (10-year), warning of potential economic recessions.
Sell
셀스마트 SIK
·
4 months ago
0
0
Buy now or hold? Let our signals guide your decision.
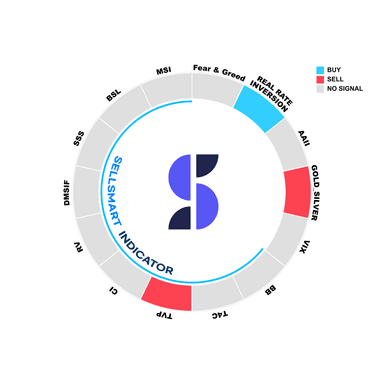
SELL signal detected for Time Varying Parameter.TVP(Time Varying Parameter) - Using time-series Bayesian techniques, this structural forecasting signal combines market indicators, macroeconomic data, and investor sentiment to predict price increases or decreases.
SELL signal detected for Gold-Silver Ratio.Gold-Silver Ratio - This signal interprets safe-haven sentiment by analyzing changes in the gold-to-silver price ratio. A rising preference for gold indicates growing market anxiety.
BUY signal detected for Real Rate Inversion.Real Rate Inversion - This signal detects abnormal yield structures where short-term real rates (1-year) exceed long-term real rates (10-year), warning of potential economic recessions.
Sell
셀스마트 SIK
·
4 months ago
0
0
Buy now or hold? Let our signals guide your decision.
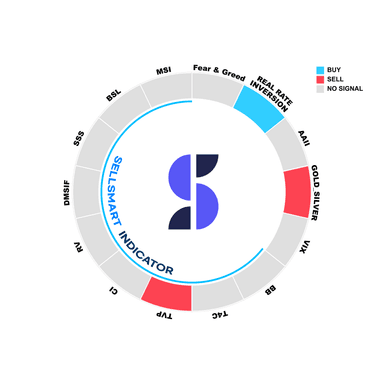
SELL signal detected for Time Varying Parameter.TVP(Time Varying Parameter) - Using time-series Bayesian techniques, this structural forecasting signal combines market indicators, macroeconomic data, and investor sentiment to predict price increases or decreases.
SELL signal detected for Gold-Silver Ratio.Gold-Silver Ratio - This signal interprets safe-haven sentiment by analyzing changes in the gold-to-silver price ratio. A rising preference for gold indicates growing market anxiety.
BUY signal detected for Real Rate Inversion.Real Rate Inversion - This signal detects abnormal yield structures where short-term real rates (1-year) exceed long-term real rates (10-year), warning of potential economic recessions.
Sell
셀스마트 SIK
·
4 months ago
0
0
Buy now or hold? Let our signals guide your decision.
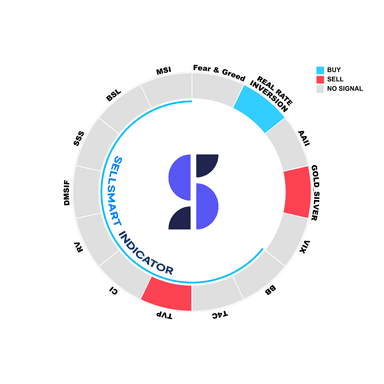
SELL signal detected for Time Varying Parameter.TVP(Time Varying Parameter) - Using time-series Bayesian techniques, this structural forecasting signal combines market indicators, macroeconomic data, and investor sentiment to predict price increases or decreases.
SELL signal detected for Gold-Silver Ratio.Gold-Silver Ratio - This signal interprets safe-haven sentiment by analyzing changes in the gold-to-silver price ratio. A rising preference for gold indicates growing market anxiety.
BUY signal detected for Real Rate Inversion.Real Rate Inversion - This signal detects abnormal yield structures where short-term real rates (1-year) exceed long-term real rates (10-year), warning of potential economic recessions.
Sell
셀스마트 SIK
·
4 months ago
0
0
Buy now or hold? Let our signals guide your decision.
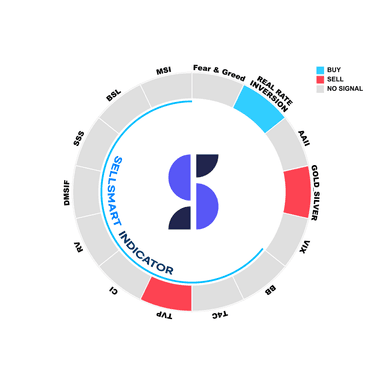
SELL signal detected for Time Varying Parameter.TVP(Time Varying Parameter) - Using time-series Bayesian techniques, this structural forecasting signal combines market indicators, macroeconomic data, and investor sentiment to predict price increases or decreases.
SELL signal detected for Gold-Silver Ratio.Gold-Silver Ratio - This signal interprets safe-haven sentiment by analyzing changes in the gold-to-silver price ratio. A rising preference for gold indicates growing market anxiety.
BUY signal detected for Real Rate Inversion.Real Rate Inversion - This signal detects abnormal yield structures where short-term real rates (1-year) exceed long-term real rates (10-year), warning of potential economic recessions.
Sell
셀스마트 SIK
·
4 months ago
0
0
Buy now or hold? Let our signals guide your decision.
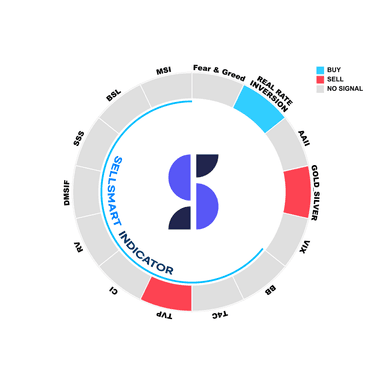
SELL signal detected for Time Varying Parameter.TVP(Time Varying Parameter) - Using time-series Bayesian techniques, this structural forecasting signal combines market indicators, macroeconomic data, and investor sentiment to predict price increases or decreases.
SELL signal detected for Gold-Silver Ratio.Gold-Silver Ratio - This signal interprets safe-haven sentiment by analyzing changes in the gold-to-silver price ratio. A rising preference for gold indicates growing market anxiety.
BUY signal detected for Real Rate Inversion.Real Rate Inversion - This signal detects abnormal yield structures where short-term real rates (1-year) exceed long-term real rates (10-year), warning of potential economic recessions.
Sell
셀스마트 SIK
·
4 months ago
Buy now or hold? Let our signals guide your decision.

Sell
셀스마트 SIK
·
4 months ago
Buy now or hold? Let our signals guide your decision.

Sell
셀스마트 SIK
·
4 months ago
Buy now or hold? Let our signals guide your decision.

Sell
셀스마트 SIK
·
4 months ago
Buy now or hold? Let our signals guide your decision.

Sell
셀스마트 SIK
·
4 months ago
Buy now or hold? Let our signals guide your decision.

Sell
셀스마트 SIK
·
4 months ago
Buy now or hold? Let our signals guide your decision.

Sell
셀스마트 SIK
·
4 months ago
Buy now or hold? Let our signals guide your decision.

Sell
셀스마트 SIK
·
4 months ago
Buy now or hold? Let our signals guide your decision.

Sell
셀스마트 SIK
·
4 months ago
Buy now or hold? Let our signals guide your decision.

Sell
셀스마트 SIK
·
4 months ago
Buy now or hold? Let our signals guide your decision.

Sell