
Hello, this is CORE16. Today, we are sharing insights on the relationship between our proprietary Entropy Indicator and the S&P 500 index. The Entropy Indicator is designed to measure information dispersion and market volatility, helping to identify periods of increasing risk before major market moves occur.
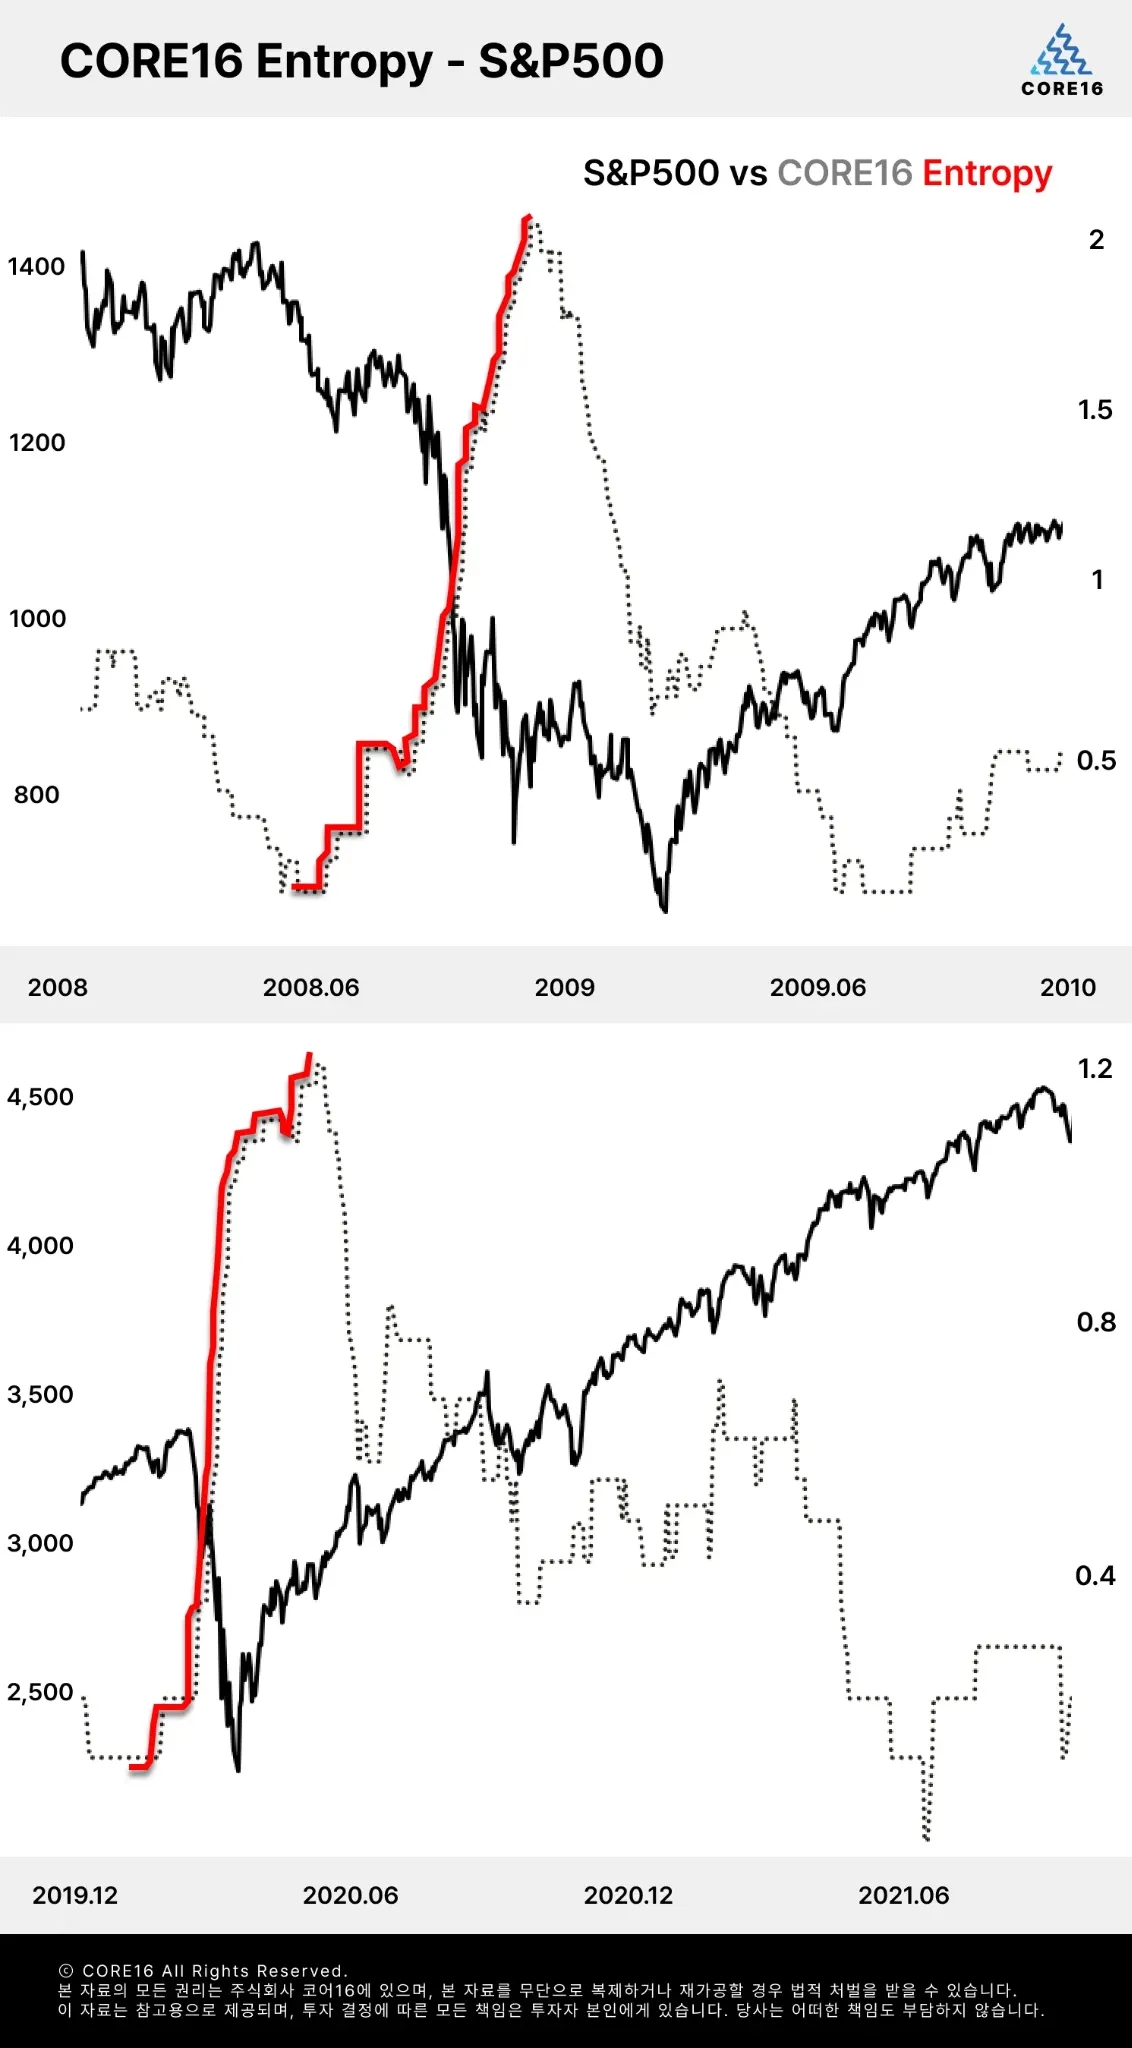
2008 Financial Crisis (Top Graph)
During the 2008 financial crisis, the red line (Entropy Indicator) spiked sharply just before the black line (S&P 500 index) experienced a steep decline. This suggests that in times of market turmoil, information dispersion (entropy) increases.
As the entropy reading began to decline, the market gradually stabilized, indicating that falling entropy levels could signal the transition to a recovery phase.
Post-2020 Market Behavior (Bottom Graph)
At the onset of the COVID-19 market panic, the Entropy Indicator surged rapidly, coinciding with a sharp market downturn.
As the entropy reading later trended downward, the market entered a rebound phase, demonstrating a pattern similar to that observed during past crises.
How the CORE16 Entropy Indicator Enhances Investment Strategy
Unlike traditional volatility indicators, the Entropy Indicator integrates multiple market signals to help investors assess whether the market is entering a high-risk phase or transitioning into a more stable environment.
Recently, the indicator has shown a strong correlation with rising macroeconomic uncertainty, reinforcing its usefulness in adjusting investment strategies. By incorporating this tool, we aim to provide a more comprehensive framework for managing market risk.